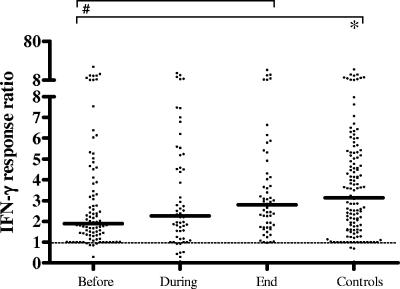
FIG. 6.
IFN-γ responsiveness as measured by synergy in TNF-α induction upon stimulation with M. tuberculosis sonicate (ratio of M. tuberculosis plus IFN-γ to M. tuberculosis only). IFN-γ significantly enhanced M. tuberculosis-driven production of TNF-α. IFN-γ responsiveness was decreased significantly in active-TB patients compared to that of controls and normalized during therapy to levels comparable to those of the control group. Each dot represents the IFN-γ response ratio of one individual. A dashed line indicates a ratio of 1. A horizontal bar indicates the median level of each group. Statistically significant differences (P < 0.05) are indicated by the symbol # between median values before, during, and at the end of the therapy (Wilcoxon signed-rank test) and by the symbol * compared to control subjects (Mann-Whitney U test).

