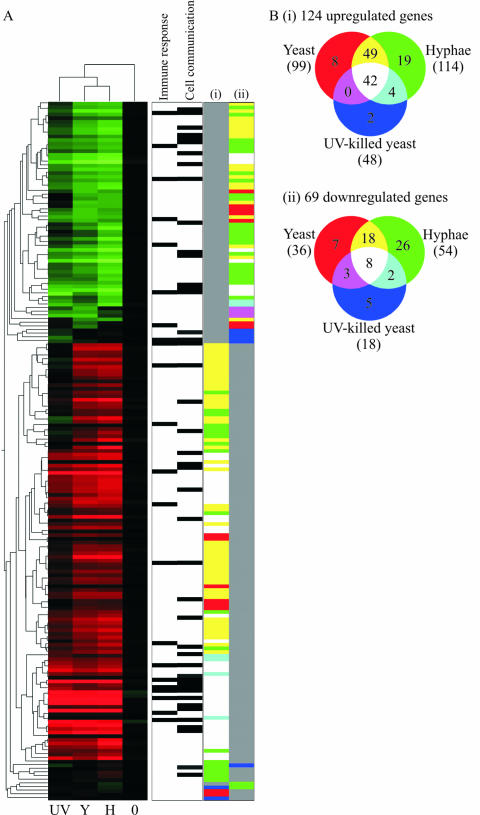
FIG. 3.
Gene expression profiles of PMNs in response to C. albicans under different conditions after 60 min of coincubation. (A) Heat map of gene expression depicting the 191 genes regulated at least twofold in PMNs in response to incubation with nil (0), UV-killed yeast (UV), live yeast (Y), or with live hyphal (H) C. albicans cells. The vertical dendrogram indicates similarities between expression patterns of the genes, while the horizontal tree shows the clustering of the different conditions. Genes annotated by gene ontology as being involved in the immune response and cell communication are marked. Columns i and ii are colored according to the appropriate Venn diagram in panel B. (B) Venn diagrams indicating the number of genes upregulated (i) or downregulated (ii) under each condition or combination of conditions.

