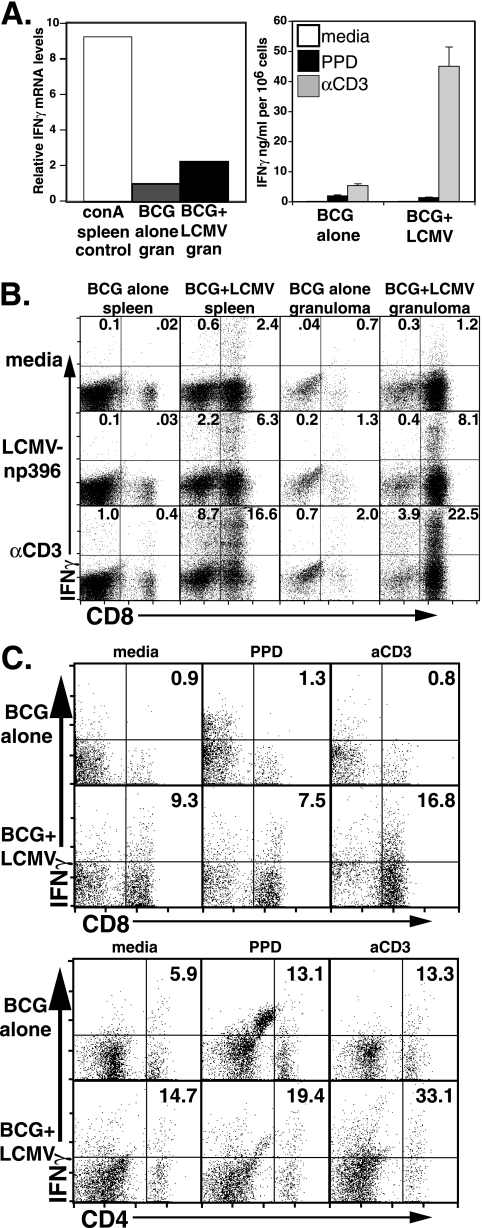
FIG. 3.
LCMV coinfection increases IFN-γ mRNA levels. (A) The left-hand panel shows the relative expression level of IFN-γ primer-specific product in cDNAs prepared from granuloma total RNA in one experiment. The value derived from BCG control granuloma was arbitrarily set to 1, and the value for concanavalin A (conA)-stimulated spleen cDNA is included for comparison. The right-hand panel shows the levels of secreted IFN-γ measured by ELISA after 3 days of in vitro culture in media, with mycobacterial PPD antigen, or with 5 μg/ml of αCD3. Error bars represent the SEM. (B) Intracellular staining for IFN-γ was performed on splenocytes and granuloma infiltrating cells from either BCG alone infection or BCG+LCMV coinfection. Cells were cultured for 5 h in the presence of Golgistop in media (top row), with 0.2 μg/ml of LCMV np396-404 peptide (middle row) or with 5 μg/ml of αCD3 (bottom row). Dot plots show anti-CD8 and anti-IFN-γ specific antibody staining on lymphocyte-gated cells from the indicated populations. The numbers are the percentage of gated cells in the quadrants. (C) Intracellular staining for IFN-γ was performed on granuloma infiltrating cells from either BCG alone infection (top rows) or BCG+LCMV infection (bottom rows). Cells were cultured overnight without Golgistop in medium alone (left plots), with mycobacterial PPD (middle plots), or with 5 μg/ml of αCD3 (right plots). After Golgistop addition, the cells were cultured for an additional 4 to 6 h before staining. Dot plots show anti-CD8 (top set) or anti-CD4 (bottom set) and anti-IFN-γ specific antibody staining on lymphocyte gated cells from the indicated populations. The numbers are the percentages of gated cells in quadrants.

