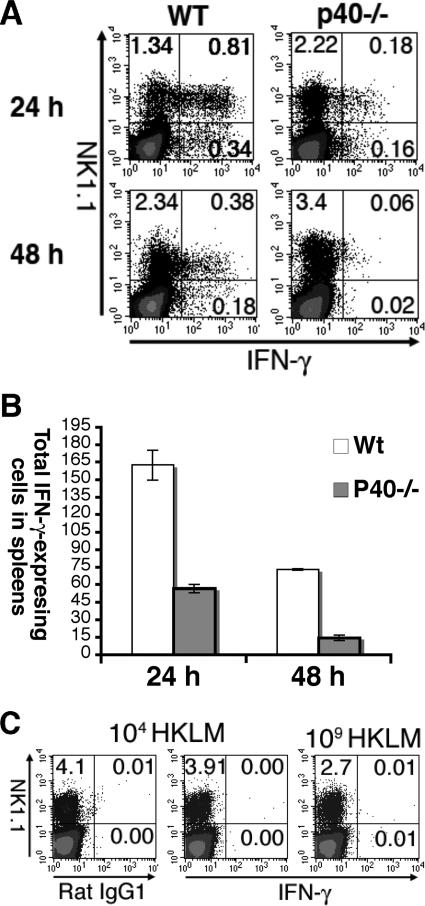
FIG. 5.
IFN-γ expression is largely dependent on IL-12 p40 and live L. monocytogenes infection. (A and B) Wild-type C57BL/6 and IL-12 p40−/− mice were infected with 104 L. monocytogenes organisms. Splenocytes from 24 and 48 hpi were stained for NK1.1 and intracellular IFN-γ. (A) The representative flow plots display NK1.1 staining on the y axis and IFN-γ staining on the x axis. The plots are gated on live cells. The numbers in the quadrants indicate the percentages of cells in each quadrant. (B) The numbers of total IFN-γ+ cells are presented. The data are the averages of results for three mice and represent one of two independent experiments. Error bars represent the standard deviations. The P value for the number of IFN-γ-expressing cells between wild-type and IL-12 p40−/− mice is 1 × 10⁻⁴. (C) Wild-type C57BL/6 mice were inoculated with 104 (left and middle plots) or 109 (right plot) heat-killed L. monocytogenes organisms intravenously. IFN-γ expression 24 h later was analyzed and displayed as above. The left plot displays the staining of isotype control.

