
Fig. 7.
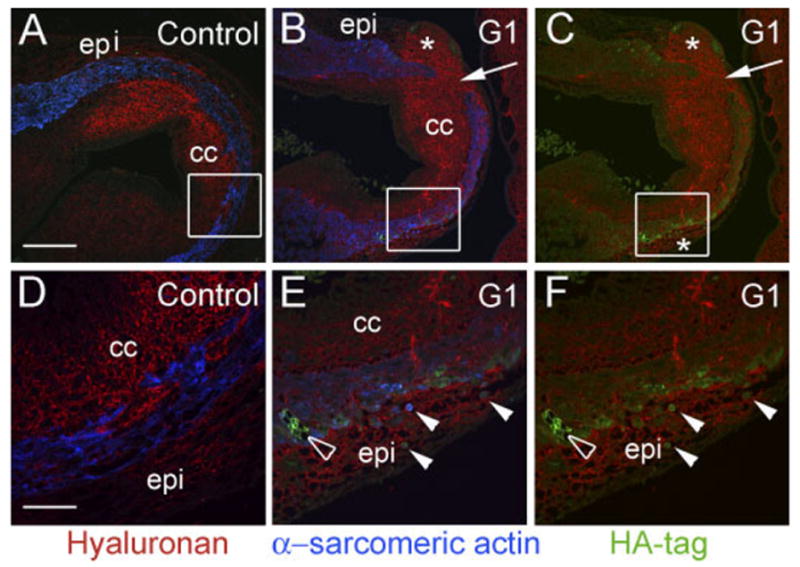
G1 causes a loss of myocardium in the proximal outflow tract (OFT). Avian embryos were injected in the anterior heart field (AHF) at Hamburger and Hamilton stage (HH) 20 with G1-expressing adenovirus and harvested at HH29. A and D show the normal myocardial wall (α -sarcomeric actin–positive cells, blue) surrounding the conal cushions of the proximal outlet in control embryos. B, C, E, and F show proximal OFTs from embryos injected with G1-expressing virus. G1 expression resulted in an abnormal loss of α -sarcomeric actin–positive myocardium (arrows in B and C) compared with controls. B and C boxes denote areas in which the myocardium appeared thin and there was a relatively high level of G1, as detected by HA-tag antibodies (green). D shows high magnification of the box in A. Normal myocardial cells exhibit a “fibroblastic” appearance. E shows high magnification of the box in B. F depicts high magnification of the box in C. In E and F, G1-infected cells demonstrate an abnormal rounded appearance (arrows). E and F show that G1-expressing, sarcomeric actin–positive cells are present in the epicardium (solid arrowheads). The open arrowhead shows G1-infected cells within the myocardial wall that appeared to have lost cell–cell contact. epi, epicardium; cc, conal cushions. The asterisk denotes an increase in hyaluronan staining within the epicardium of G1-infected hearts. Scale bars = 150 μm in A (applies to B,C), 50 μm in D (applies to E,F).