
Fig. 1.
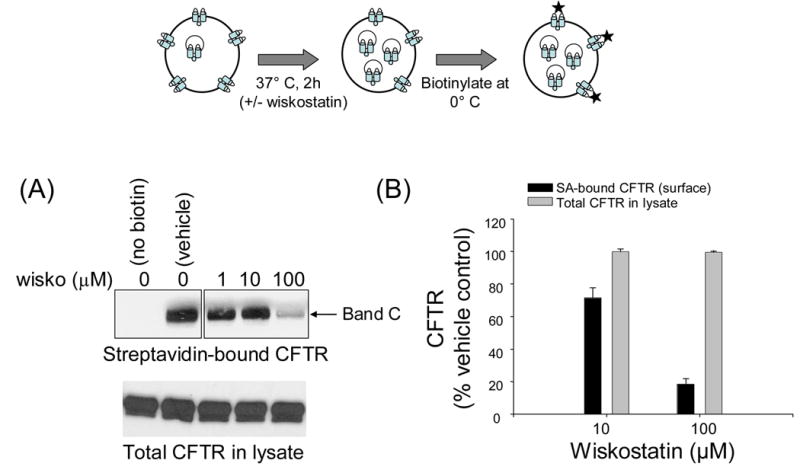
Wiskostatin decreases steady-state surface CFTR expression in a dose-dependent manner. Top panel, schematic representation of labeling cell-surface proteins with NHS-SS-biotin. A, surface-biotinylated CFTR captured with streptavidin-agarose (upper) or total CFTR protein (lower) in lysates of BHK cells treated with vehicle or indicated doses of wiskostatin for 2h. Band C represents mature, fully glycosylated CFTR. The blots in the upper panel represent data from a single experiment in which additional lanes not relevant to this experiment were removed. B, CFTR signals at indicated doses of wiskostatin were quantified by densitometry and normalized to the CFTR signals in vehicle-treated cells. The bars represent means ± S.E. calculated from 3 separate experiments.