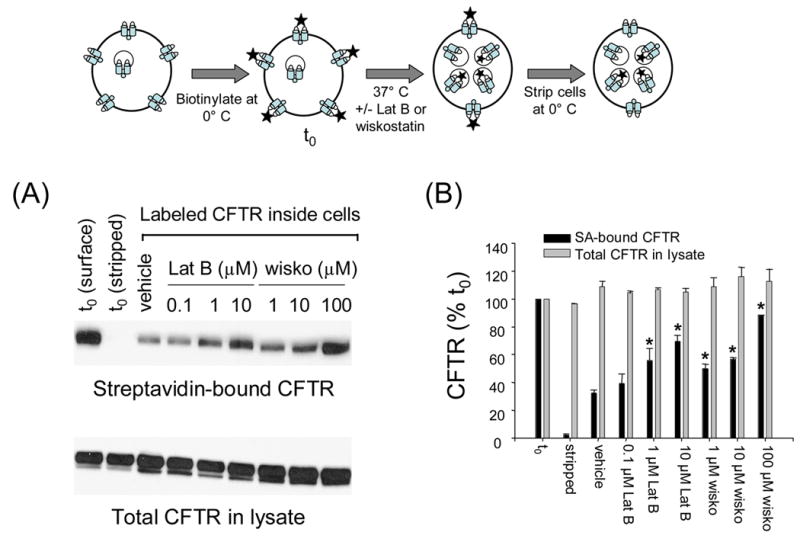
Fig. 2.

Wiskostatin and latrunculin B increase the fraction of surface-biotinylated CFTR that accumulates within the cells at steady-state. Top panel is a schematic representation of the CFTR internalization assay. t0 represents surface CFTR molecules labeled before wiskostatin/latrunculin B treatment (2h each). A, biotinylated CFTR (upper) or total CFTR protein (lower) in lysates of BHK cells treated with vehicle or indicated doses of latrunculin B or wiskostatin. B, CFTR signals at indicated doses of wiskostatin or latrunculin B were quantified by densitometry and normalized to the CFTR signal at t0. Note that >95% of signal is lost in samples stripped by MESNA at t0.The bars represent means ± S.E. of 3 separate experiments. The asterisks indicate p< 0.05 relative to vehicle control.
