
Figure 7.
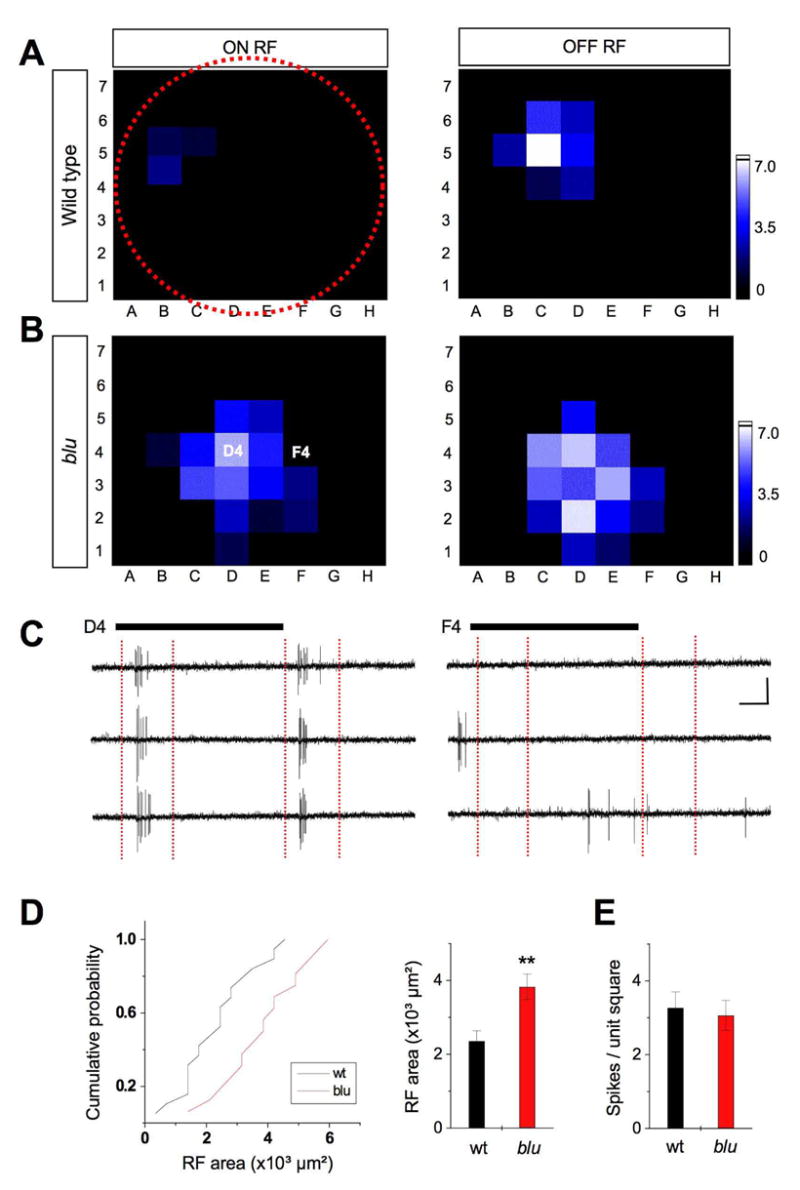
Receptive fields of tectal neurons are enlarged in blu mutant. A. Example of an ON (left) and OFF (right) RF from a 7 dpf wild-type larva. The red-dotted circle depicts the relative size of the entire visual field (retinal surface). B. Example RF from a 7 dpf blu mutant. The brightness of each unit in the 56-square grid represents the average number of spikes (three repetitions) evoked by the corresponding stimulus. See scale on the right. C. Response traces of three repetitions are shown for stimulus position in D4 (left) and F4 (right) in the example shown in B. ON and OFF RFs are analyzed within time windows (red vertical dashed lines) that cover ON responses and OFF responses respectively. Black bars represent the duration of the stimulus (1.5 s). Scales: 20 pA, 250 ms. D. Left, cumulative distribution of RF sizes (number of squares showing spike responses, multiplied by 350 μm²). Right, average RF area. RFs in blu mutants are, on average, 60% larger than in wt. **, p < 0.001, Kolmogorov-Smirnov test. E. Average number of spikes per square unit within the RF. Local input strength is similar between blu and wt.