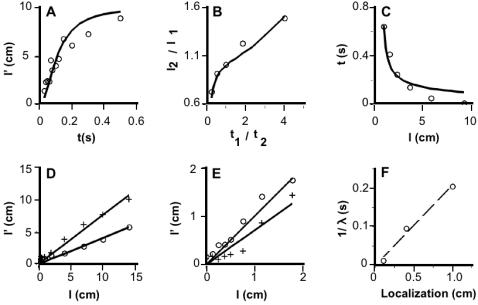
Figure 3.

Human data from five studies (symbols) and basic Bayesian observer's performance on the same tasks (solid curves in A–E). For each study, the value of λ was chosen to minimize the mean-squared error between model and human performance. (A) Rabbit on forearm (Fig. 1A) [12]. R2: 0.80. λ: 12.7/s. (B) Two-arm tau effect (Fig. 1C) [17]. x-axis: IST ratio ( pair 1/pair 2 ). Pair 1 ISTs (from left to right) were 0.2, 0.35, 0.5, 0.65, and 0.8 s; pair 2 IST = 1.0 s-pair 1 IST. y-axis: ISD ratio ( pair 2/pair 1 ) that resulted in equality of perceived ISDs ( pair 1 l' = pair 2 l' ). Pair 1 ISD was fixed at 10 cm. R2: 0.95. λ: 9.4/s. (C) Perceptual merging experiment (Fig. 1D) [18]. R2: 0.92. λ: 4.2/s. (D) Two-stimulus distance estimation for longitudinally separated stimuli on forearm (circles) and horizontally separated stimuli on forehead (crosses) at 0.24 s IST (Fig. 1E) [19]. Forearm R2: 0.94. Forehead R2: 0.90. Forearm λ: 4.9/s. Forehead λ: 10.5/s. (E) Two-stimulus distance estimation for longitudinally separated taps to the index finger [20]. Circles: 1.1 s IST; crosses: 26 ms IST. R2 (1.1 s): 0.94, R2 (26 ms): 0.90. λ: 85.1/s. (F) Point localization accuracies for finger, forehead, and forearm [5] plotted against 1/λ (dashed line). R2: 0.99.
