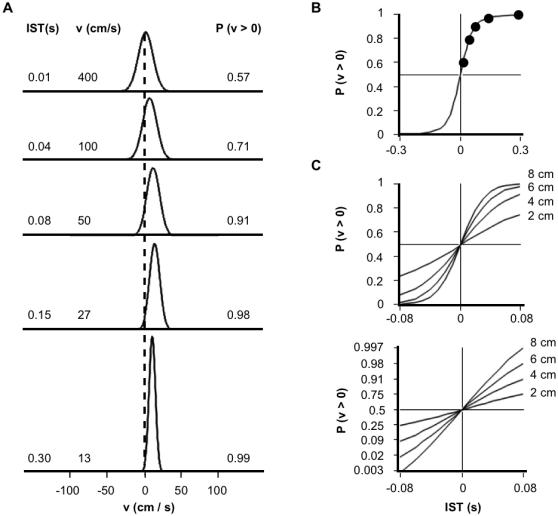
Figure 4.

Temporal order judgments of the basic Bayesian observer. (A) Posterior probability distributions for velocity, for 4 cm ISD and 0.01 s-0.30 s ISTs, obtained by integrating across the corresponding 2-dimensional posterior probability distributions (e.g., Fig. 2B, lower left). A second integration finds the area under each curve to the right of zero, P(v>0). (B) TOJ curve, plotting P(v>0) from (A), and additional values for the opposite movement direction (negative x-axis), against IST. (C) Upper panel: TOJ curves for 2 cm to 8 cm ISD, and −80 ms to 80 ms IST. Lower panel: The same curves plotted with y-axis probit (cumulative normal probability) coordinate spacing. As with human TOJ curves plotted in this manner [26]–[28], these curves are linear. Model parameter values used for all panels: σs, 1 cm; σv , 10 cm/s.
