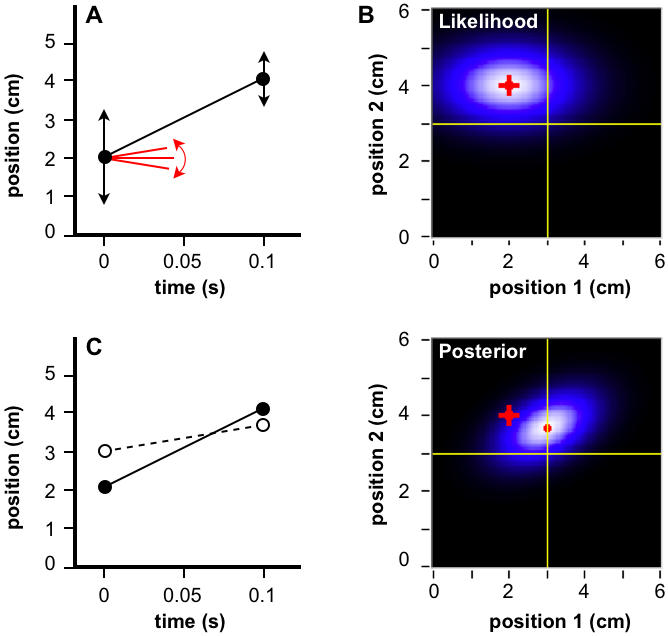
Figure 5.

Basic Bayesian observer with directed spatial attention. (A) Plot of the same stimuli (filled circles) shown in Figure 2. Attention directed to the location of the second stimulus lowers σs2 and increases σs1 (vertical arrows: ±1 σs). The observer considers slow trajectories most probable a priori (red slopes: ±1 σv). (B) Likelihood and posterior distributions in positional trajectory space (The prior is identical to that shown in Fig. 2). The oval-shaped likelihood distribution results because σs1≠σs2. The mode of the posterior (red dot) shows that the perceived location of the first stimulus has shifted more than that of the second stimulus, relative to their actual locations (red crosshairs). (C) Actual (filled circles, solid line) and perceived (open circles, dashed line) trajectories. The midpoint of the perceived trajectory has shifted towards the location of stimulus 2 by 0.3 cm relative to the actual trajectory midpoint. Model parameter values used for all panels: σs1, 1.23 cm; σs2, 0.70 cm; σv , 10 cm/s.
