
Figure 1.
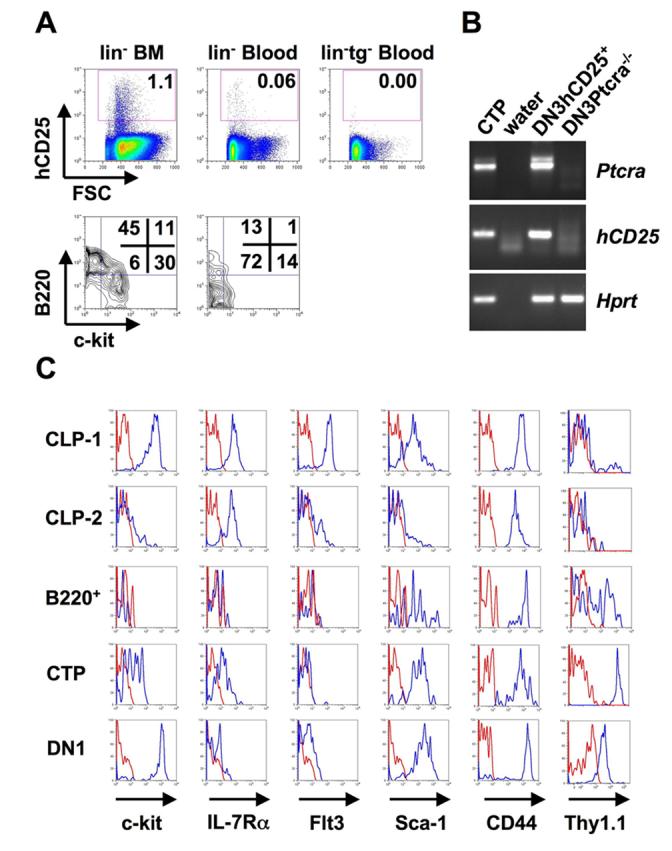
Circulating lin−hCD25+ precursors. (A) Lineage depleted BM and blood cells from hCD25 transgenic and non-transgenic mice were stained for lineage markers, hCD25, c-kit and B220. The lower panels show the expression of c-kit and B220 of electronically gated lin−hCD25+ cells. Numbers in FACS plots indicate percentages of cells within gates or quadrants. (B) Expression of pre-TCRα in circulating lin−hCD25+ cells. RT-PCR was performed on 250 CTP cells. The same amount of cDNA from hCD25+ DN3 cells and DN3 cells from Ptcra−/− mice was used as positive and negative controls, respectively. One representative out of 2 independent experiments is shown. (C) Expression of surface markers on different lin−hCD25+ populations. BM CLP-1 (lin−hCD25+ckit+B220−) and CLP-2 (lin−hCD25+c-kit−/loB220+) cells, blood lin−hCD25+B220+ cells (“B220+”) and CTP (lin−hCD25+B220−) and thymic hCD25+ DN1 (lin−CD25−CD44hihCD25+) cells were stained for c-kit, IL-7Rα, Flt3, Sca-1, CD44 and Thy-1.1. Histograms show expression levels of the respective surface markers (blue histograms) or unstained controls (red histograms) of electronically gated populations as indicated above. One representative out of 2 independent experiments is shown.