
Figure 3.
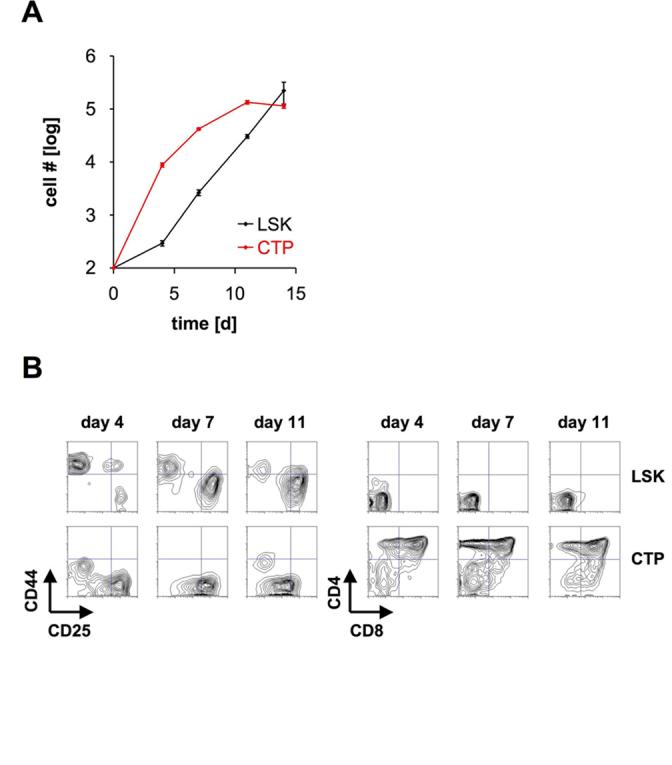
Developmental progression and expansion of CTP. (A) 100 blood derived LSK cells and 100 CTP were sorted and co-cultured on OP9-DL1 cells. Cell numbers were assessed by FACS. Data are shown ± SEM (n=4). (B) 100 blood derived LSK cells and 100 CTP were co-cultured on OP9-DL1 cells. After 4, 7, and 11 days cells were analyzed for the expression of CD4 and CD8 (right panels) and electronically gated CD4−CD8− DN cells for the expression of CD44 and CD25 (left panels). One representative out of 2 independent experiments is shown.