
Figure 5.
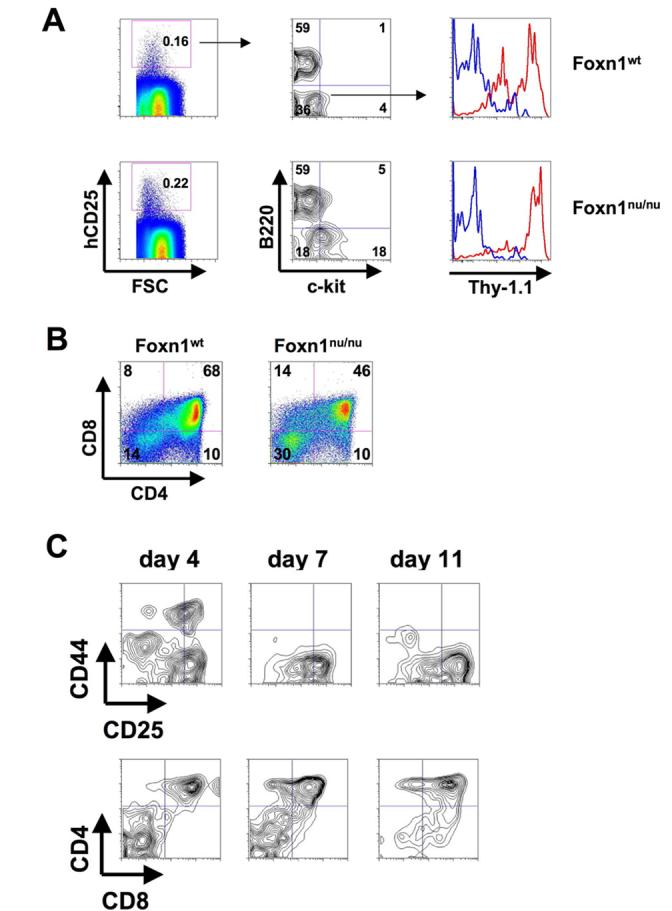
CTP are present in peripheral blood of Foxn1nu/nu mice. (A) CTP from hCD25 transgenic Foxn1nu/nu mice and hCD25 transgenic Foxn1wt littermates were analyzed by FACS. Cells were stained with antibodies against lineage markers, hCD25, c-kit, B220 and Thy-1.1 to reveal the frequency of lin−hCD25+ CTP. Numbers in FACS plots indicate percentages of cells within gates or quadrants. One representative out of 4 independent experiments is shown. (B) 200 CTP from hCD25 transgenic Foxn1nu/nu mice and hCD25 transgenic Foxn1wt littermates were sorted and co-cultured on OP9-DL1 cells. After 14 days cells were analyzed for the expression of CD4 and CD8. Numbers in FACS plots indicate percentages of cells within quadrants. One representative out of 3 independent experiments is shown (C) 100 CTP from hCD25 transgenic Foxn1nu/nu mice were sorted and co-cultured on OP9-DL1 cells. After 4, 7, and 11 days cells were analyzed for the expression of CD4 and CD8 (lower panels) and electronically gated CD4−CD8− DN cells for the expression of CD44 and CD25 (upper panels). One representative out of 2 independent experiments is shown.