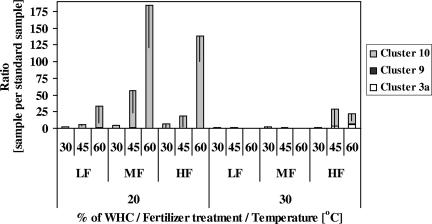
FIG. 2.
Effect of temperature, soil moisture, and fertilizer concentration on total abundance of betaproteobacterial ammonia oxidizers. The total abundance was normalized to a standard sample (see the text). The stacked bars represent the contribution of each phylogenetic group to the total abundance. Percent WHC represents the percent of the soil's maximum water-holding capacity. LF, MF, and HF treatments represent fertilizer concentrations of 0.05, 0.1, and 0.3%, respectively. Error bars are 95% confidence limits of the total abundance.

