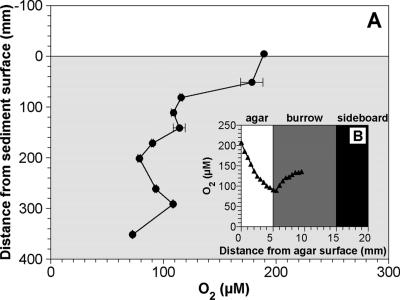
FIG. 4.
(A) Vertical O2 concentration profile along an infaunal burrow, measured in the aquarium with slits filled with agar plates in a sideboard. (B) Data points were obtained from the horizontal O2 concentration profiles at different depths. The values indicate the average O2 concentrations at the center of the burrow (i.e., 10 mm from agar surface). The error bars indicate the standard deviations of the measurements for 10 min at each position. (B) A typical horizontal O2 concentration profile in an infaunal burrow. An O2 microelectrode was inserted into the center of a burrow through the agar plate. Zero millimeters, 5 mm, and 10 mm on the horizontal axis correspond to the agar surface, the agar-burrow interface, and the center of the burrow, respectively.

