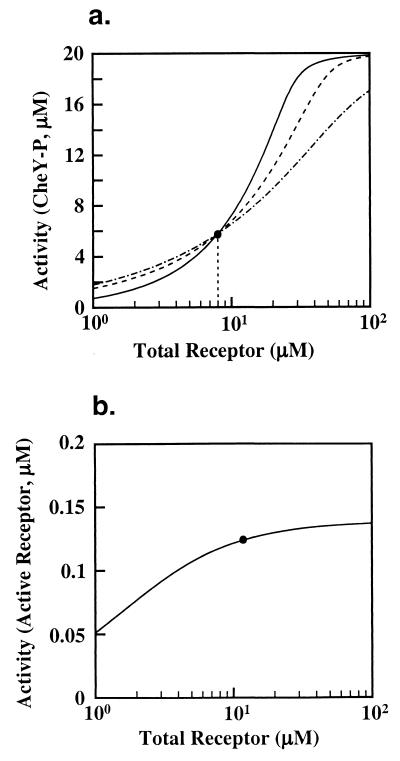
Figure 1.
Robust and nonrobust perfect adaptation. The dependence of steady-state system activity on total receptor concentration was calculated by using equilibrium analysis for three concentrations of chemoattractant: (i) L = 0 (solid), (ii) L = 1 μM (dashed), and (iii) L = 1 mM (dashed–dot). The filled circle indicates the value of total receptor used in the model. (a) Spiro model. The system activity is measured in terms of the concentration of CheY-P. The intersection of the three lines, which coincides with the filled circle, represents the value of total receptor at which perfect adaptation exists. (b) Barkai–Leibler model. The system activity is measured in terms of the concentration of active receptor complexes. The three lines completely overlap. These plots were performed by using the program xppaut (34, 35).

