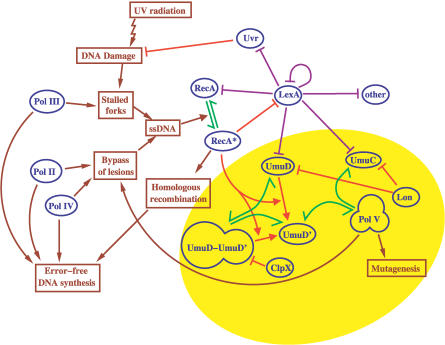
Figure 1. Schematic Representation of the SOS Network in E. coli, Including Proteins, Functional States of DNA, and Key Processes.
The purple lines indicate transcriptional regulation, the red lines active degradation and proteolytic cleavage, and the green lines complex formation. The yellow shading highlights the proteins involved in mutagenesis, centered around the Pol V DNA polymerase, a complex consisting of an UmuD′ homodimer and UmuC.

