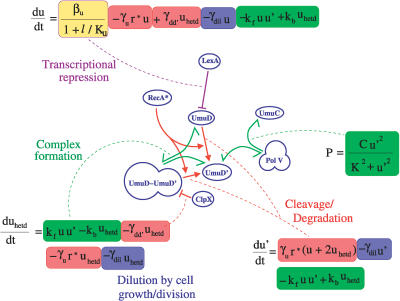
Figure 3. Mutagenesis Subnetwork and Associated Dynamical Equations (Only Those Links Are Shown That Have Corresponding Terms in the Equations).
u, u′, and uhetd are the concentrations of UmuD, UmuD′, and UmuD–UmuD′ heterodimer, respectively. r* is the RecA* level. l is the LexA level. kf, kb, βu, Ku,γu, γdd ′ , γdil, C, and K are parameters (see Methods for their values). The equations describe (1) LexA repressed production of UmuD (highlighted in yellow), (2) RecA*-mediated cleavage of UmuD (highlighted in red), (3) heterodimerization of UmuD and UmuD′ (highlighted in green), (4) degradation of UmuD′ by ClpX when in the heterodimer, releasing UmuD (red), (5) dilution of all proteins due to cell growth/division (indicated by blue), and (6) formation of Pol V (green).

