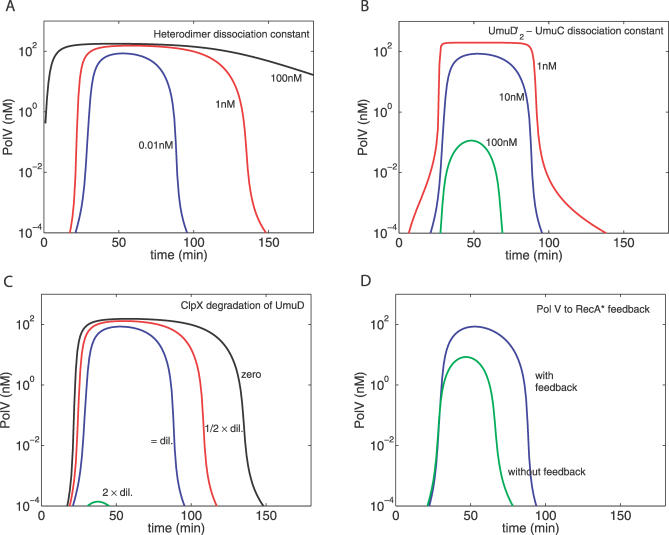
Figure 7. Temporal Profile of Pol V Following a UV Dose of 20 J/m2 as a Function of Various Parameters.
(A) The three curves refer, respectively, to strong (Kdd′ = 0.01 nM, blue), medium (Kdd′ = 1 nM, red), and weak (Kdd′ = 100 nM, black) binding between UmuD and UmuD′.
(B) The effects of changing the binding constant between the UmuD′ homodimer and UmuC: as binding strength 1/K in Equation 12 increases (K = 100,10,1 nM for the green, blue, and red curves, respectively), the Pol V concentration saturates at the 200 nM value set by the maximum cellular level of UmuC.
(C) For strong binding (Kdd′ = 0.01 nM), the three curves show the effect of increasing the degradation rate γdd′ of UmuD′ by ClpX. As a default, the degradation rate is set equal to the dilution rate γdil (blue). The rate is half of the dilution rate for the red curve, whereas it is zero for the black curve. For the green curve, the degradation rate is double that of the dilution rate, which—at this level of UV damage—results in almost no Pol V.
(D) The effect of removing the Pol V to RecA* feedback. The blue curve is when there is feedback (as in Figure 7 A–C). The green curve is when there is no feedback, i.e., τstalled = τstalled(0), irrespective of the Pol V level.

