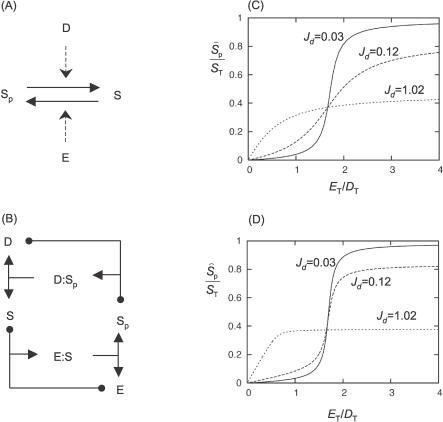
Figure 1. Goldbeter–Koshland Module.
(A) Substrate S is phosphorylated by kinase E and dephosphorylated by phosphatase D.
(B) Unpacked mechanism, including enzyme–substrate (E:S) complexes. The black dots at the tips of a T-shaped arrow indicate the two molecules that come together to form a complex, pointed to by the arrowhead; the dots are meant to indicate that enzyme–substrate binding is a reversible reaction. Formation of the product (E:S → E + P) is indicated by a T with two arrowheads (pointing to E and P); absence of a dot at the foot indicates that the catalytic step is presumed to be irreversible.
(C) Steady state value of Ŝ p from Equation 8 is plotted against E T/D T for k 2d/k 2e = 1.7, K me = K md = 1 nM, S T = 50 nM, and for different values of D T: 0.5 nM (solid line), 5 nM (dashed line), and 50 nM (dotted line).
(D) Same as (C), but using the exact steady state equations in Table 1 instead of using the Padé approximant. For D T = 5 nM, the exact steady state dependence is ultrasensitive, whereas the approximated dependence (C) is not.

