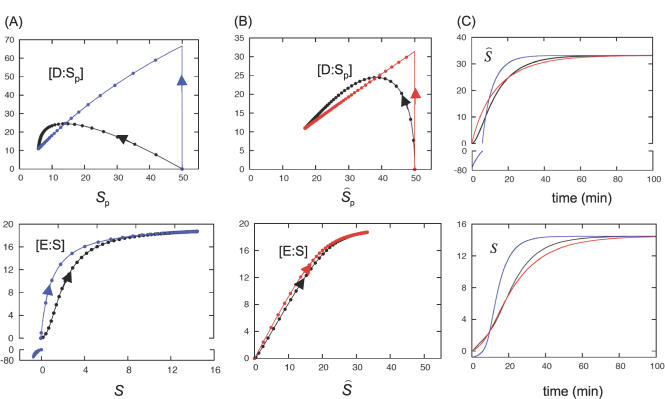
Figure 2. Comparison of QSSA and tQSSA for the GK Module.
The simulation shows the rise of S(t), starting from S(0) = 0, S p(0) = S T. Equations in Table 1, parameter values in Table 2. Both E and D are initially uncomplexed, E(0) = E T and D(0) = D T.
(A) Exact solution (black line), QSSA solution (blue line). The arrows indicate the direction of time, whereas the distance between two consecutive dots on the lines is 1 min.
(B) Exact solution (black), tQSSA solution (red).
(C) Time evolution of the same simulation, with the same color scheme. The enzyme–substrate complexes in this simulation are not negligible. In particular, at steady state, E is almost completely bound to S, whereas at the beginning of the time course, D:Sp accounts for roughly half of all substrate molecules.

