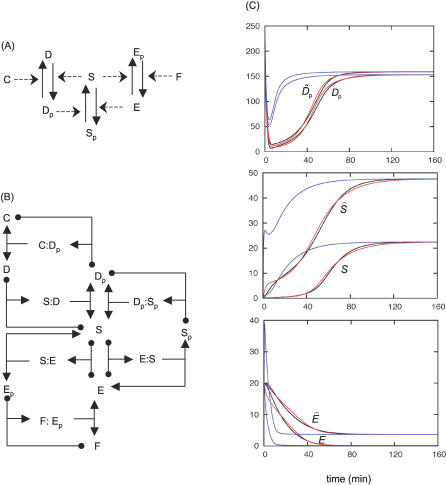
Figure 4. The Novak–Tyson Model for the G2/M Transition.
(A) A simplified diagram shows all the actors of the network: two kinases S and E, and three phosphatases C, D, and F.
(B) The unpacked diagram, keeping track of all enzyme–substrate complexes. Diagram conventions as in Figure 1.
(C) The time course of the network shown in (B); equations in Table 4, parameter values in Table 2. Initial conditions: D p = 200 nM, S = 0, E = 20 nM, all complexes = 0. Again, QSSA (blue) performs poorly in reproducing the dynamics of the full system (black), whereas tQSSA (red) is a good approximation. Comparisons between D, S, and E and their counterparts D2, Ŝ, and Ê show that while the complexes forming D are not present in significant amounts, S contributes about one half of Ŝ, and E's contribution to Ê is negligible.

