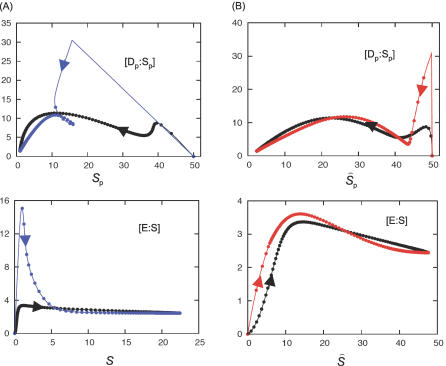
Figure 5. Timescale Separation in the Model of the G2/M Network.
The exact solution (black lines) is compared with the QSSA, blue lines in (A), and to the tQSSA, red lines in B. Arrows indicate the direction of time, whereas the distance between consecutive dots on the lines is 1 min. Equations in Table 4, parameter values in Table 2.

