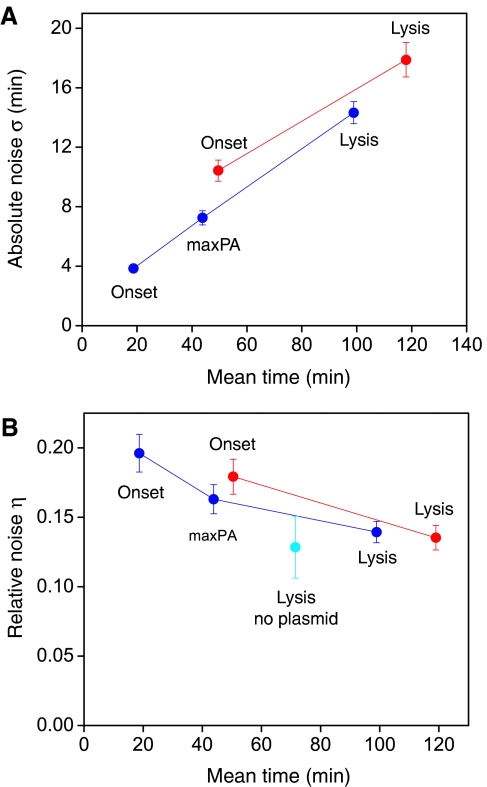
Figure 6.
Statistical analysis of fluctuations along the lytic cascade. (A) Standard deviation as a measure of width of histograms in Figure 5. Blue and red points represent data from cells harboring the pR-GFP or pR′-tR′-GFP reporter plasmids, respectively. Data were derived from at least four experimental repeats. Error bars represent one standard deviation (see Materials and methods). (B) Coefficient of variation η defined as the ratio between the standard deviation over the mean time of different stages along the lytic cascade. The value of η for lysis time is similar in experiments with pR-GFP or pR′-tR′-GFP plasmids (blue and red, respectively) and in experiments without reporter plasmids (cyan). The statistical significance for decrease in η between two adjacent points is less than 0.02 in all cases (see Materials and methods).

