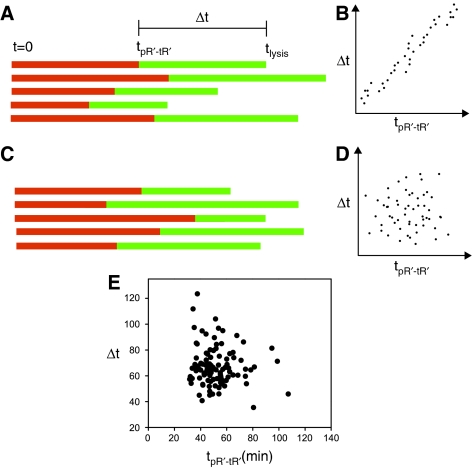
Figure 7.
Correlation of events along the lytic cascade. (A) Schematic timelines of individual cells along the lytic cascade from the time of induction at t0=0, through the onset time of pR′-tR′ expression, tpR′-tR′, and ending in the time of lysis, tlysis, assuming uniform time dilation from cell to cell, yielding the schematic correlation between the intervals Δt=tlysis−tpR′-tR′ (green) and tpR′-tR′−t0 (red) shown in (B). (C) Individual cell timelines assuming the execution of the cascade is affected by random fluctuations in timing of the various stages, in which case Δt and tpR′-tR′ vary independently, yielding the schematic correlation shown in (D). (E) Measured intervals Δt in individual cells completing the lytic cascade as a function of tpR′-tR′. A correlation analysis yields a P-value equal to 0.59, suggesting that both quantities are not correlated.

