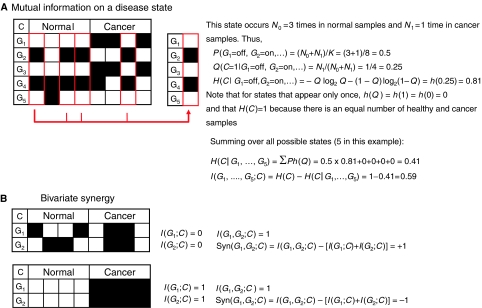
Figure 2.
Examples of numerical evaluation of mutual information and synergy. In both cases, they should be seen as illustrations of the concept and not as representative of actual biological examples, in which many samples are needed for meaningful modeling. Black squares indicate a gene being ‘on' and white squares indicate a gene being ‘off.' (A) Evaluation of mutual information between a set of five genes and cancer from four normal and four cancerous samples. (B) Evaluation of the synergy between two genes with respect to cancer, derived from four normal and four cancerous samples. Two extreme cases are shown, the first with maximum synergy +1, and the second with minimum synergy −1 (redundancy).

