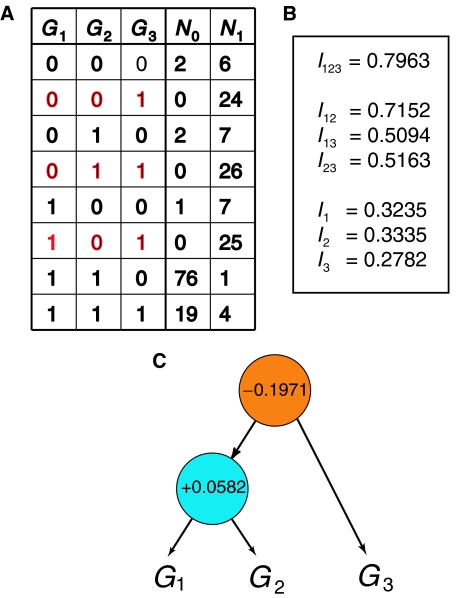
Figure 3.
From the ‘state-count table' to the ‘tree of synergy.' (A) An example of a state-count resulting from hypothetical microarray measurements of three genes G1, G2, G3 in both the presence and absence of a particular cancer C. N0 and N1 are the counts of each state in the absence and presence of cancer, respectively. (B) The amounts of mutual information between each subset of the set of three genes and the presence of cancer, with simplified notation (see text). (C) The tree of synergy resulting from these sets making repeated use of the formula defining multivariate synergy. This decomposition separates the full set into two redundant subsets, one of which is the synergistic pair of genes G1, G2, consistent with the assumptions under which the state-count table was simulated.

