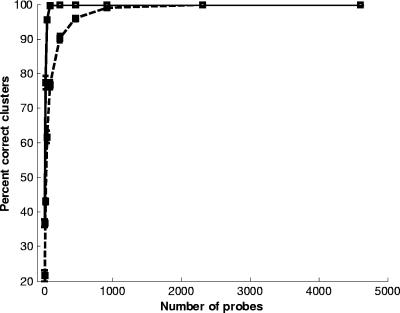
FIG. 2.
Percent correct identification of two clusters (A and B; solid line) or all four clusters (A, B, C, and D; dashed line) as a function of the number of microarray probes included from the Enterococcus MGM analysis. The mean and standard deviation (bars) of the percentage correct identification for each probe subset for 10 iterations, each with 1,000 runs, is shown.

