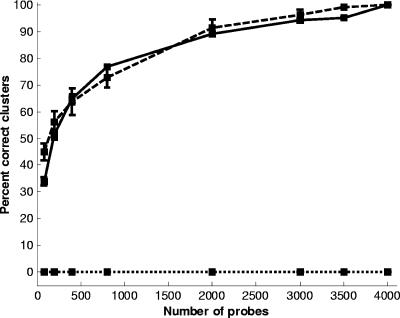
FIG. 5.
Comparison of an unequally represented Streptococcus array before (dotted line) and after (dashed line) library bias correction with an equally represented Streptococcus array (solid line). For each subset size of the array, the mean and standard deviation of the percentage of correct identification of clusters A, B, and C are plotted as a function of the number of microarray probes.

