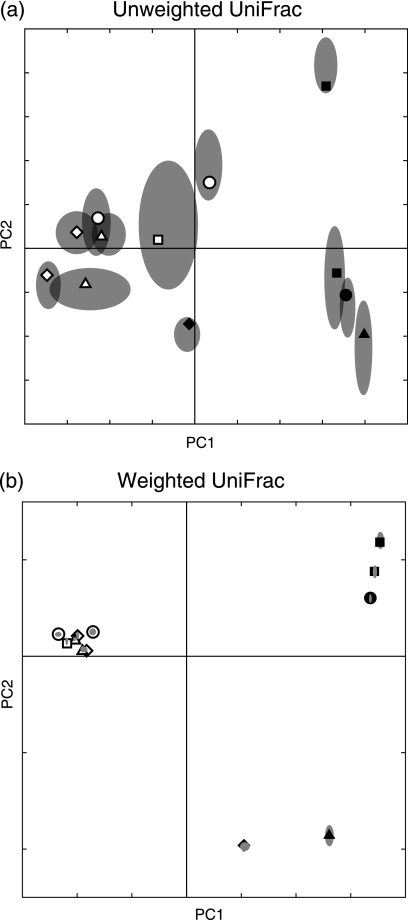
FIG. 3.
Jackknifing of PCoA analysis of hot spring sediment samples with unweighted and weighted UniFrac. Shown is a plot of the first two principal coordinate axes (factors) for PCoA with the neighbor-joining tree. Point locations are the average location in the 100 jackknife replicates. Only 50 randomly selected sequences from each sample were used in each replicate (the range of sequences per sample was 65 to 96). Gray ellipses represent the IQR for the 100 jackknife replicates. The 95% confidence intervals for the point locations were also calculated and were considerably smaller than the IQRs (data not shown). The symbols are the same as those shown in Fig. 2.

