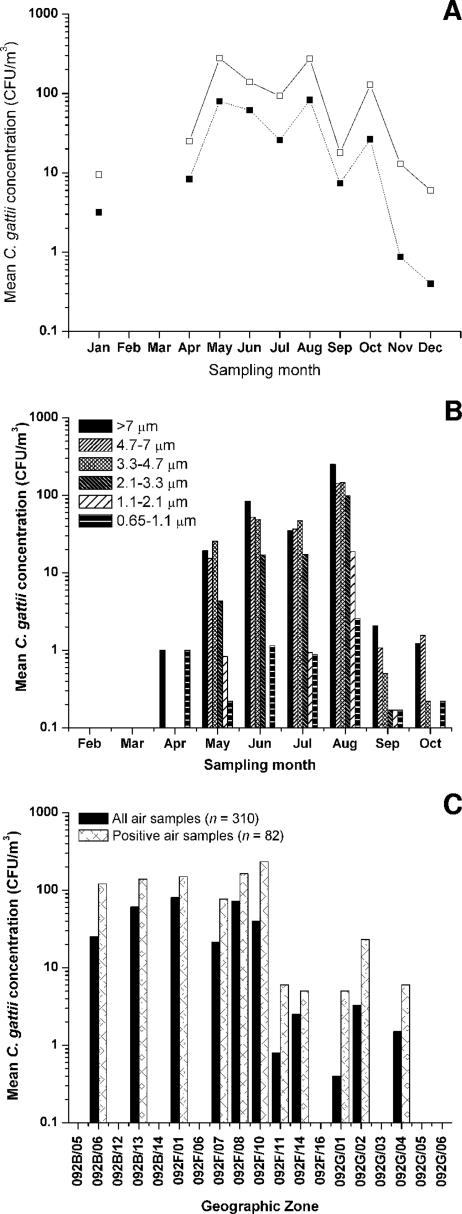
FIG. 6.
Characterization of air samples collected systematically between 2002 and 2004. (A) Mean C. gattii concentrations among all air samples (closed squares; n = 310) and positive air samples (open squares; n = 82) collected at different months of the year. (B) Mean concentrations of C. gattii stratified by propagule size during different months of the year. Andersen air samples were collected from February through October, for which the C. gattii concentrations shown represent those among all attempted samples (n = 118). (C) Mean C. gattii concentrations detected in air samples collected from different geographic grid regions of British Columbia.

