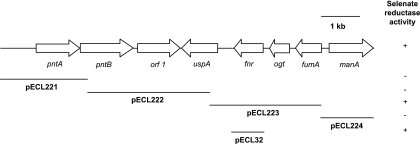
FIG. 2.
Map of the 9.76-kb HindIII fragment cloned from E. cloacae SLD1a-1. Arrows depict gene location and transcriptional direction. Lines with plasmid designation depict specific clones tested for selenate reductase activity. + or −, positive or negative for selenate reductase activity, respectively.

