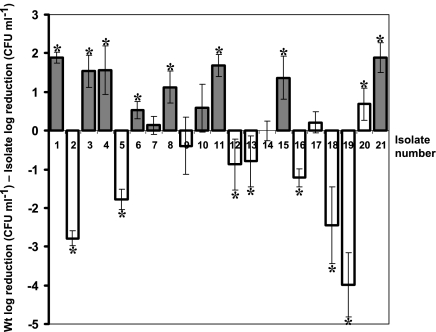
FIG. 2.
Thermotolerance of isolates expressed as the log difference in reductions in CFU between each isolate and the wild type (Wt). Positive values denote higher resistance than that of the wild type, while negative values denote higher sensitivity. Dark bars represent small-colony variants, while light bars represent isolates with normal colony morphologies. Experiments were performed on cells in the exponential phase which were exposed to 58°C for 30 min. Reductions in numbers of viable CFU were determined in triplicate for each isolate, and error bars represent standard deviations of the log differences between reductions in CFU of the wild type and the isolates. Asterisks denote significant differences between the log reductions in CFU of the isolates and the wild type (P < 0.05).

