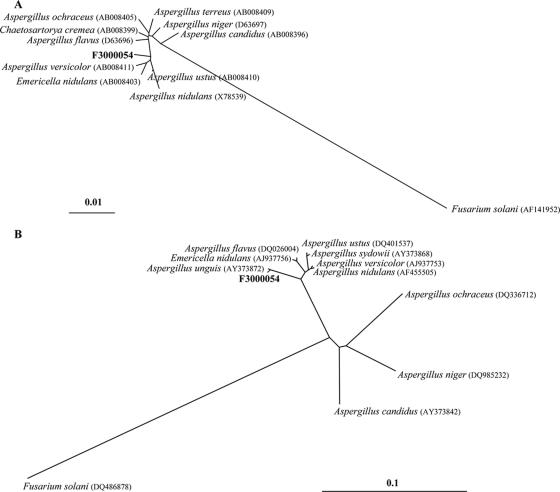
FIG. 2.
Phylogenetic analyses of selected aligned 18S rDNA (A) and ITS1 (B) sequences. Unrooted trees were generated by means of the neighbor-joining method and the Jukes and Cantor algorithm model. Fusarium solani (DQ486878) was used as the out-group for both analyses. The scale bars indicate the expected numbers of base substitutions per site, with bar lengths corresponding to 1% and 10% differences for 18S rDNA and ITS1 regions, respectively.

