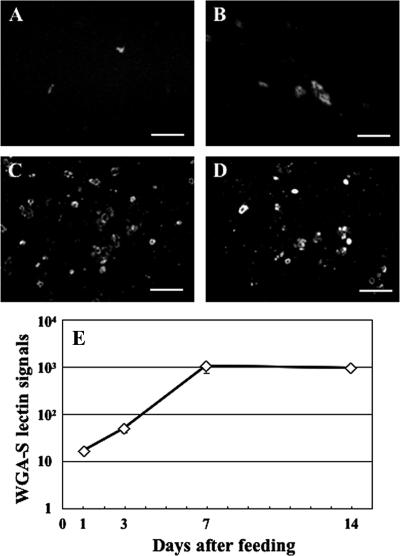
FIG. 4.
Number of lectin signals in the ILF after feeding. (A to D) Microscopy images of lectin (WGA-S) staining of the ILF. One daf (A), 3 daf (B), 7 daf (C), or 14 daf (D). Bars, 50 μm. (E) The number of lectin signals changed significantly during the observed period (median test, P < 0.0001). Means ± standard errors are plotted (n = 5, 5, 3, or 4 at 1 daf, 3 daf, 7 daf, or 14 daf, respectively).

