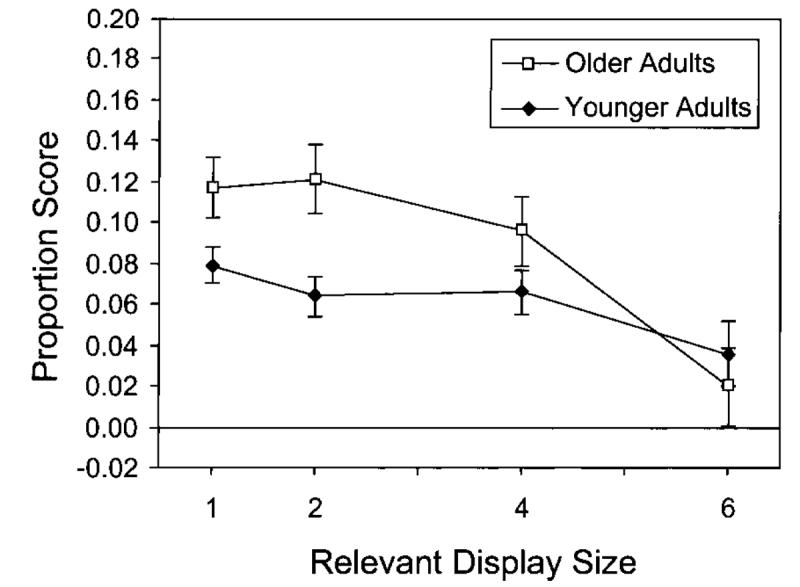
Figure 6.

Mean reaction time proportion scores (with standard error bars) representing compatibility effects [(incompatible RT-neutral RT)/neutral RT] for younger and older adults as a function of relevant display size (no. of letters) in Experiment 3.
