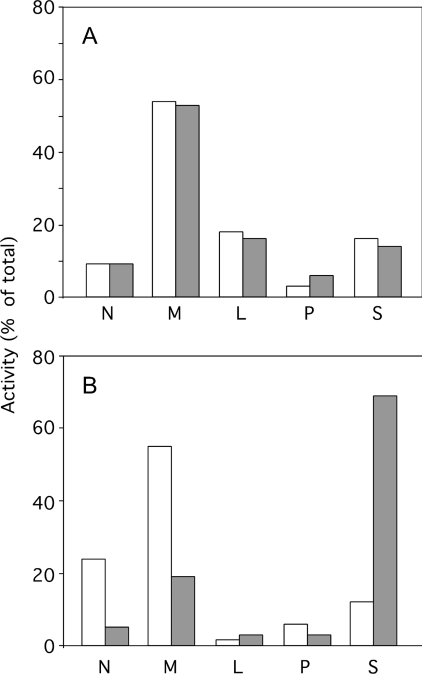
Figure 3. Distribution of β-galactosidase (A) and sulfite cytochrome c reductase (B) after differential centrifugation in 0.25 M sucrose.
N, nuclear fraction; M, heavy mitochondrial fraction; L, light mitochondrial fraction; P, microsomal fraction; S, soluble fraction. Liver originated from a saline-injected mouse (open bars) or from an aFas-injected mouse killed 60 min after injection (closed bars). DEVDase activities of homogenates were respectively 0.1 nmol/min per liver for the control and 90.1 nmol/min per liver for the aFas-injected mouse.

