
Figure 3.
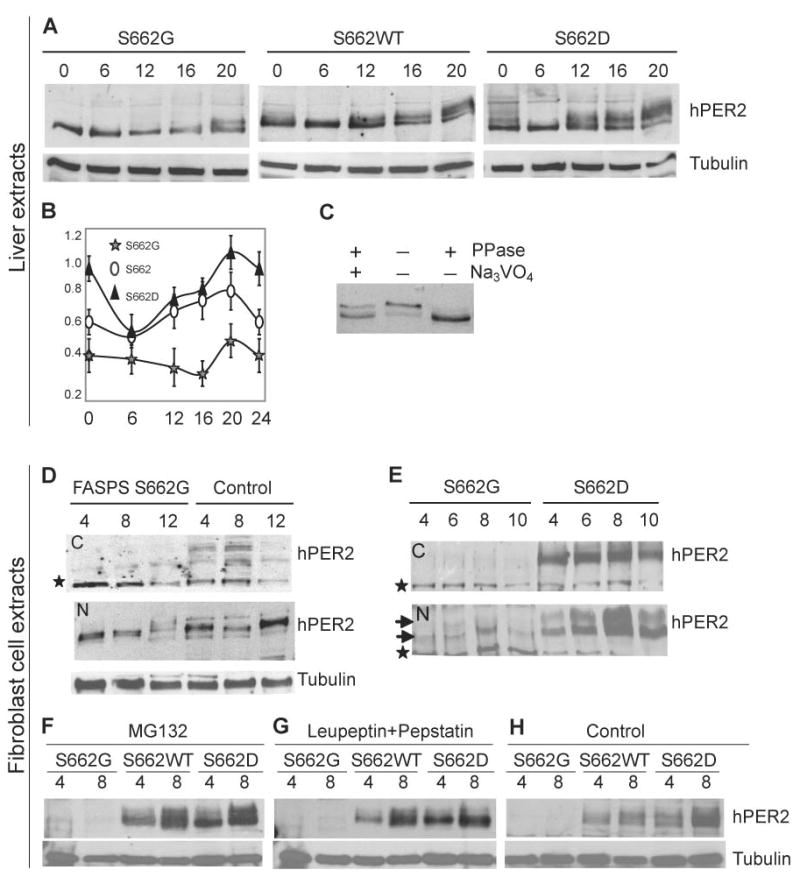
PER2 S662 phosphorylation results in increased PER2 protein. (A) hPER2 abundance and phosphorylation in S662G, S662WT, and S662D transgenic mouse liver extracts (nuclear fractions) at different CTs. (B) Quantification of protein from liver extracts in (A). Bars represent standard deviation for each time point in 3 independent experiments. Differences using the t-test were statistically significant (p<0.05) for S662G vs. S662D at all time points, for S662 vs. S662G at all time points except 6 hr., and for S662 vs. S662D at t=0, 20, and 24. (C) Immunoprecipitated complexes from S662D mouse liver at CT16 were untreated, or treated with either phosphatase alone or both phosphatase and sodium vanadate. Changes in PER2 mobility are due to changes in phosphorylation. (D) hPER2 from human S662G and control fibroblasts show that protein is primarily in the nuclear fractions (‘N’ vs. cytosolic ‘C’) and that levels of hPER2 protein were lower in S662G subjects vs. controls. The star represents a non-specific band that serves as an internal loading control. (E) Western blot analysis of cultured fibroblasts from S662G and S662D transgenic mice. Upper and lower arrows indicate low and high mobility hPER2 protein. hPER2 protein is undetectable in cytosolic fractions (‘C’) of S662G transgenic mice and are much higher (C and N) in S662D transgenic mice. (F) Fibroblasts were cultured, serum-shocked, and MG132 was added at t=0 and again at 4 hr. Cells were harvested at times 4 and 8 hr. The proteasome inhibitor MG132 does not lead to an increase in S662G hPER2 protein. (G) Lysosome inhibitors were added to cells 2 hr. after serum shock and 2hr. before cells were harvested at times 4 and 8 hr. The lysosome inhibitors leupeptin and pepstatin failed to increase S662G hPER2 protein. (H) Control cells were treated with vehicle (DMSO) at t=0 for the 4 hr. time point and at t=0 and t=4 for the 8 hr. time point.