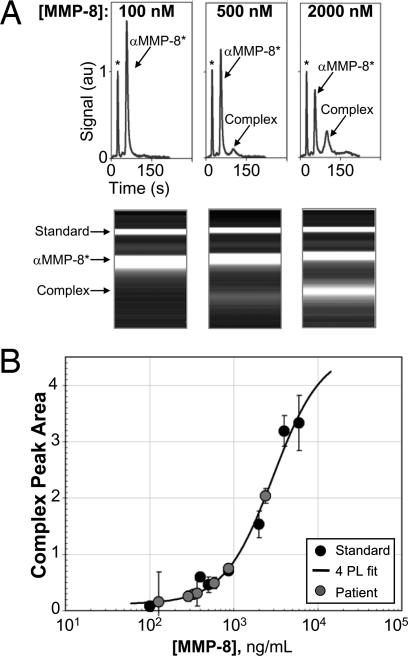
Fig. 3.
Calibration of the MMP-8 μCEI using pooled saliva from healthy controls. (A) Electropherograms and corresponding gel-like plots for MMP-8 standard sample analyses demonstrate detection of recombinant human MMP-8 spiked into saliva at known concentrations. (B) MMP-8 dose–response curve generated by μCEI. The MMP-8 complex peak areas of the standard samples (black filled symbols) are plotted as a function of known MMP-8 concentration. A four-parameter logistic model (4PL, solid line) of the form y = β2 + (β1 − β2)/(1 + (x/β3)β4) was fit by the method of nonlinear least-squares to the standard samples. The 4PL fit was used to calculate the concentration of endogenous MMP-8 in the patient saliva samples (gray filled symbols).

