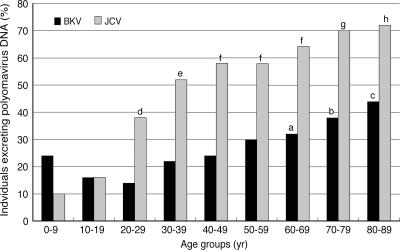
FIG. 1.
Incidence of urinary excretion of polyomavirus DNA in various age groups. There were 50 individuals in each age group. a, P < 0.05 versus the 20- to 29-year-old group; b, P < 0.05 versus the 10- to 19-year-old group and P < 0.01 versus the 20- to 29-year-old group; c, P < 0.01 versus the 0- to 9-, 10- to 19-, 30- to 39-, and 40- to 49-year-old groups and P < 0.01 versus the 20- to 29-year-old group; d, P < 0.01 versus the 0- to 9-year-old group and P < 0.05 versus the 10- to 19-year-old group; e, P < 0.01 versus the 0- to 9- and 10- to 19-year-old groups; f, P < 0.01 versus the 0- to 9- and 10- to 19-year-old groups and P < 0.05 versus the 20- to 29-year-old group; g, P < 0.01 versus the 0- to 9-, 10- to 19-, and 20- to 29-year-old groups; h, P < 0.01 versus the 0- to 9-, 10- to 19-, and 20- to 29-year-old groups and P < 0.05 versus the 30- to 39-year-old group.

