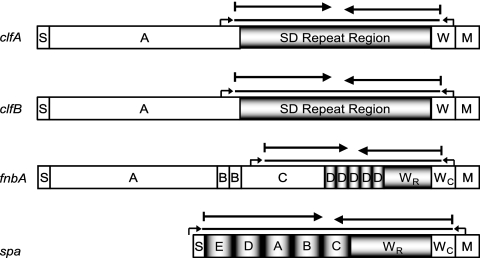
FIG. 1.
Schematic representation of clfA, clfB, fnbA, and spa, constructed on the basis of data from a previous report (8). Boxes indicate segments of each gene with signal sequences (S), wall-spanning regions (W), repeated and conserved wall-spanning regions (WR and WC, respectively), and membrane-spanning regions (M). Boxes labeled A to E are domains that were previously assigned. Repeated segments are indicated with vertical black and white shadings (each segment represents one repeat motif), whereas regions with small repeat motifs are indicated with horizontal black and white shading. Small arrows indicate primer annealing sites located in conserved regions flanking the repeat-containing regions. The different sequences of regions used for analyses are indicated by lines above the boxes. Continuous black lines represent the whole amplified repeat-containing regions (clfA, clfB, fnbA, and spa), long arrows indicate 500-bp partial sequences of the 3′ or 5′ region of the genes (3p500 or 5p500, respectively) which were taken for analysis. PCR amplification products varied in size mostly due to variation in repeat number; thus, it is possible that partial 5′ and 3′ sequences overlap.

