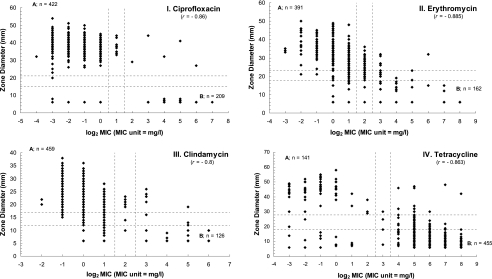
FIG. 1.
Scatter plot of the MICs in the agar dilution method and the zone diameters in the disk diffusion method with tentative breakpoints (dashed line) for ciprofloxacin (I), erythromycin (II), clindamycin (III), and tetracycline (IV) against Campylobacter species. A, the area where Campylobacter isolates were susceptible to the antimicrobial agent by both the agar dilution and the disk diffusion methods. B, the area where Campylobacter isolates were resistant to the antimicrobial agent by both the agar dilution and the disk diffusion methods. The values of −4, −3, −2, −1, 0, 1, 2, 3, 4, 5, 6, and 7 on the x axis represents the log2 MIC of each MIC, which are equivalent to 0.0625, 0.125, 0.25, 0.5, 1, 2, 4, 8, 16, 32, 64, and 128 μ/ml, respectively.

