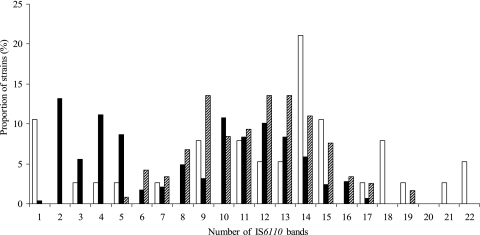
FIG. 1.
Distribution of IS6110 band numbers among the three principal genetic groups based on the analysis of 444 strains obtained from Arkansas between 1 January 1996 and 31 December 2000. x axis, number of the IS6110 hybridizing bands; y axis, proportion of strains in each of the three principal genetic groups by IS6110 copy number. The white bar represents group 1; the black bar represents group 2; and the hatched bar represents group 3.

