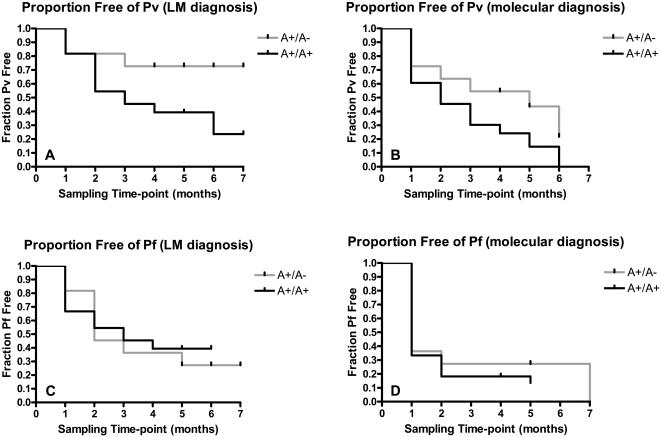
Figure 2. Susceptibility to blood-stage infection during monthly prevalence surveys (1998–99); matched longitudinal analyses.
Evaluation of cumulative Pv and Pf erythrocyte infection was performed among Duffy A+/A− vs A+/A+ individuals matched by age, sex, and village of residence. A, Diagnosis of Pv erythrocyte infection was performed by light microscopy (LM) (p = 0.049; log-rank test) [16]. B, Diagnosis of Pv erythrocyte infection was performed by LDR-FMA (p = 0.065; log-rank test) [20]. C, Diagnosis of Pf erythrocyte infection was performed by LM (p = 0.675; log-rank test). D, Diagnosis of Pf erythrocyte infection was performed by LDR-FMA (p = 0.453; log-rank test). In A through D, light gray lines represent A+/A− (n = 11) and dark gray lines represent A+/A+ (n = 33).

