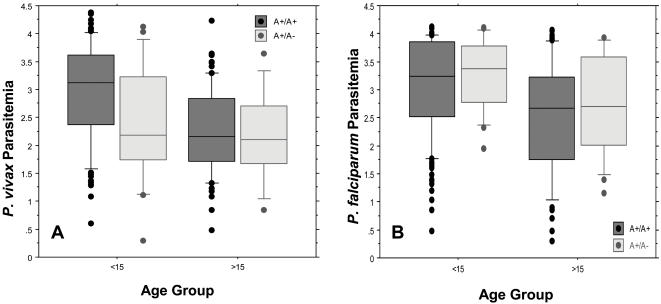
Figure 3. Semi-quantitative LDR-FMA Diagnosis of Pv and Pf infections split by Duffy Genotype and Age Group.
A, Comparison of Pv fluorescent signal intensity (log10-transformed) of individuals who had a Pv-positive blood sample split by Duffy genotype (matched on age, sex, village of residence, and survey period). For children less than 15 years of age, A+/A+ (n = 105) mean fluorescent signal intensity = 2.96, A+/A− (n = 18) mean fluorescent signal intensity = 2.37 (Mann-Whitney P = 0.023). For individuals over 15 years, A+/A+ (n = 66) mean fluorescent signal intensity = 2.22, A+/A− (n = 15) mean fluorescent signal intensity = 2.16 (Mann-Whitney P = 0.86). B, Comparison of Pf fluorescent signal intensity (log10-transformed) of individuals who had a Pf-positive blood sample split by Duffy genotype (matched on age, sex, village of residence, and survey period). For children less than 15 years of age, A+/A+ (n = 146) mean fluorescent signal intensity = 3.08, A+/A− (n = 17) mean fluorescent signal intensity = 3.22 (Mann-Whitney P = 0.742). For individuals over 15 years, A+/A+ (n = 89) mean fluorescent signal intensity = 2.51, A+/A− (n = 22) mean fluorescent signal intensity = 2.69 (Mann-Whitney P = 0.529).

