
Fig. 2. A. Resonance energy transfer between F18 and R18 labeled membranes.
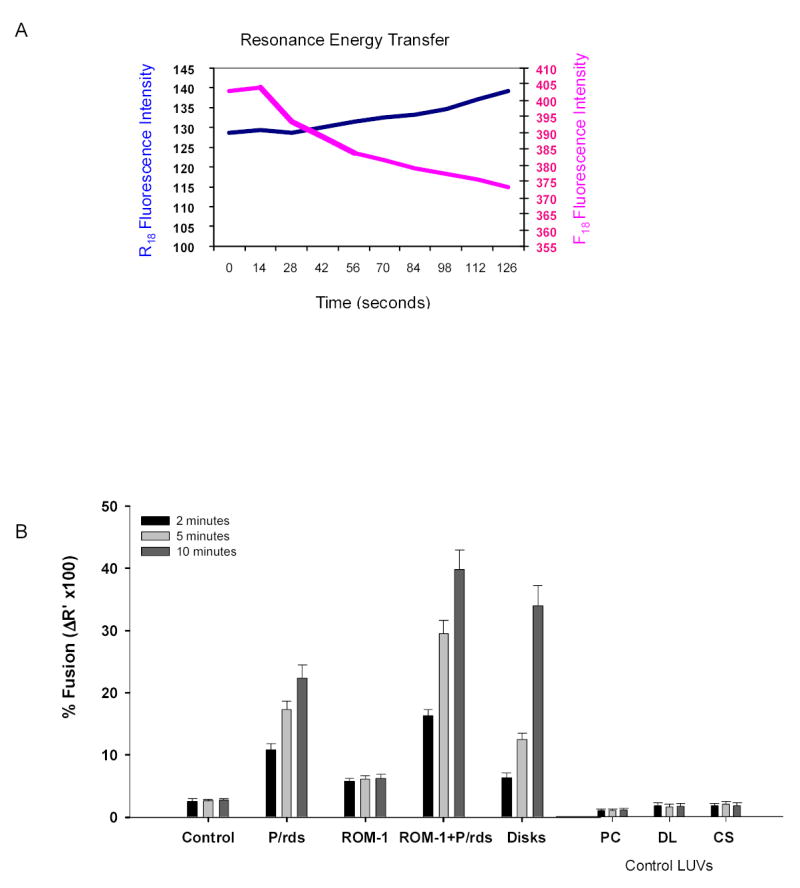
A representative fluorescence emission scan showing an increase in R18 emission (λem=592, blue line) with a concomitant decrease in F18 emission (λem=524, pink line) during the fusion of two labeled membrane species. In this particular experiment fusion between F18-labeled COS cell intracellular membranes (expressing FLAG-peripherin constructs) and R18-labeled bovine ROS plasma membrane was measured FRET as described above in the Methods All fusion assays were carried out at room temperature under dim light. B. Fusion between R18-PM and F18-target membranes. FRET- based fusion assays were used to follow fusion between R18-PM and membrane(s) isolated from Control (mock-transfected COS cells) and cells expressing P/rds, ROM-1 or P/rds + ROM-1 in co-transfection analyses. Control target membranes, phosphatiodylcholine LUV (PC LUV), disk lipid extract LUV (DL LUV) or cos cell membrane extract LUV (CS) were prepared as described in the methods. The results show the % fusion at 2 min (black bars), 5 min, (light-gray bars) and 10 minutes, (dark gray bars). All assays were compared to fusion between R18-PM and F18–disks (indicated as disks). Fusion was initiated with the addition of R18-PM to F18-target membranes in 96 well plates at RT. Data represent mean +/+ SE of three independent preparations each done in at least duplicate.