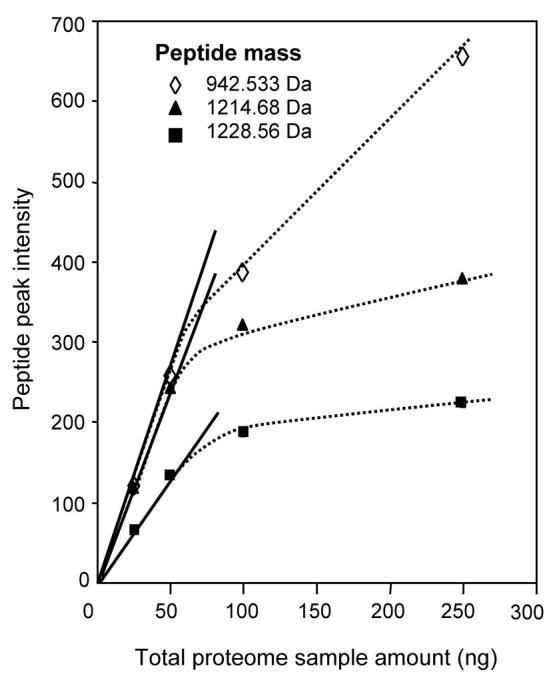
Figure 10.

ESI-MS peak intensities vs. the total proteome sample size for three high-abundance peptides in a tryptic digest of a yeast cell lysate. The results were obtained using a 30-μm-i.d. packed capillary (∼80 nL/min flow rate). For sample sizes below a given level, MS peak intensities increase in a linear fashion with sample size (solid line); above this level, suppression effects are evident. Reprinted with permission from Shen, et al., 2002. Copyright 2002 American Chemical Society.
