Figure 11.

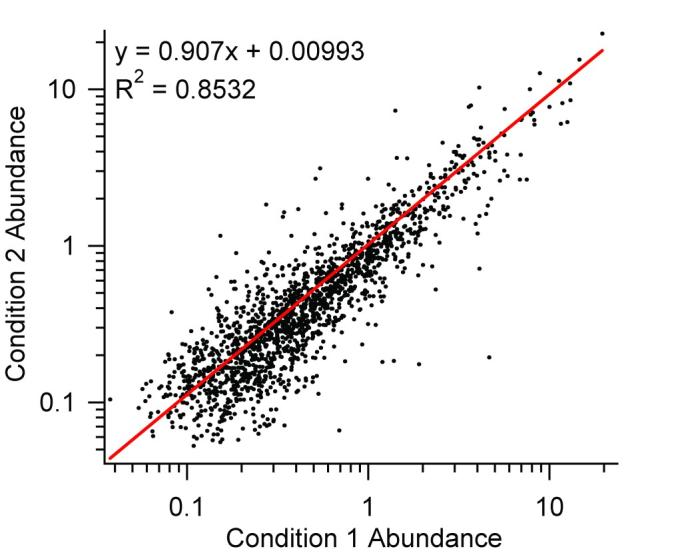
Comparison of peptide absolute abundance values for two S. oneidensis samples from two biological conditions. Logarithmic scales have been used to better illustrate the data at lower peptide abundances.

Comparison of peptide absolute abundance values for two S. oneidensis samples from two biological conditions. Logarithmic scales have been used to better illustrate the data at lower peptide abundances.