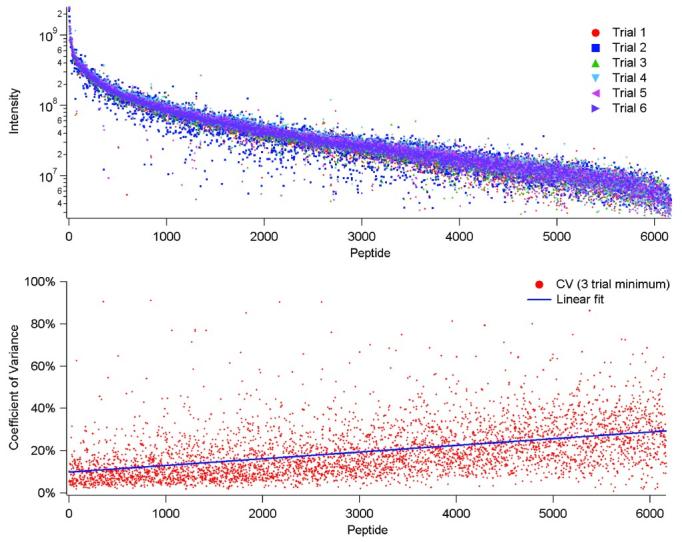
Figure 19.

Reproducibility of absolute abundance values for mass and time tags identified in six replicate capillary LC-FTICR-MS analyses of a S. oneidensis tryptically digested proteome sample. The upper plot compares the intensity values seen for each identified AMT tag across the six replicates while the lower plot represents the coefficient of variance in intensity across the replicates.
